You can help sustain ICTG's free online education with your gift today.
Phases of Disaster Response
Last Updated June 2019.
This image is a visual guide to aid in organizational and community conversations about collective trauma response.
As a leader of a school, business, nonprofit, or congregation, you may find this aid especially useful for helping your staff to recognize how everyone heals from trauma at different paces. This understanding can help inform individuals as they assess resuming "business as usual" and the degree to which they may be helped by additional therapeutic resources outside the organization.
Generally, the four phases listed on the charts tend to take 24-60 months for a community to process through, though this estimate is based on anecdotal evidence.
* Note: This guide is an educational aid and is not prescriptive. Every trauma and healing process is unique, even when commonalities exist.
This guide also does not depict cases in which a culmination of events may result in collective trauma symptoms, or cases in which a community may have experienced multiple disasters within a year or two. However, in those more complex circumstances, this chart may still prove a helpful conversation aid to highlight ways in which individual members may be processing at their own paces.
Phase Descriptions
Hero Phase
Following sudden impact, or the sudden revelation of catastrophic event(s), generally, survivors experience a sudden adrenaline rush often referred to as a "hero" phase. This phase tends to involve a lot of "business" related to what has happened. This time may involve getting people out of harm's way or evacuations, search and rescue, mucking out, psychological first aid, hospital visits, prayer chains, meal trains, memorial services or funerals, assessment, investigation, and countless other necessary tasks. This phase can last days, weeks, months, or, some communities find, over a year.
Disillusionment Phase
This phase tends to be marked by a pervasive feeling of exhaustion. As people experience adrenaline waning, they often describe feeling achy and lethargic. It also can be a time when survivors describe an overall sense that nothing they physically do can change what has happened. Many report feeling a lot of emotions in this phase, emotions that may have been held at bay during the hero phase due to so many tasks requiring attention. Emotions may include grief, sadness, sorrow, mourning, guilt, loneliness, gratitude, appreciation, peace, and much more. This phase generally lasts for weeks or months.
Turning
How does a group know they have started the process of rebuilding and restoring? Many communities make attempts to jump right to rebuilding during the hero phase. Some communities see the downward slope of disillusionment as a "negative" or as "depression" rather than a general loss of energy, which is normal following an adrenaline rush. Instead, some survivors hope to "stay up". However, many times, these attempts prove unsustainable. The more lasting attempts to rebuild and restore tend to occur after survivors have had a chance to rest and recoup following the adrenaline rush that commonly occurs following a disaster. At ICTG, we find communities tend to know they've reached the end of the disillusionment phase when most people in their group honestly feel a sense of two truths: they can acknowledge the loss that has occurred, and they sense there still is good in the world. Coming to a sense of those two truths often takes time, and is most genuine when not rushed or forced.
Rebuilding and Restoration Phase
This phase involves business again, but this time it tends to be collaborative, patient, steady, and focused on the best interests of the range of people who have been impacted by what has happened. It also tends to be creative and inspired by mutual efforts representing a range of voices from the community. While survivors tend to feel a general momentum toward progressing forward during this phase, survivors also report experiencing ups and downs throughout this time when they may feel occasional bouts of sadness or experience sudden memories of grief. Still, in most cases, survivors tend not to feel these moments as lasting or debilitating.
Wiser Living Phase
This phase has many names, including "new normal." It generally refers to an acknowledgment that what has occurred has changed the community in a lasting way. Though healing can happen, there may be scars. This phase also represents the loss of innocence that may have occurred, a recognition that what has happened does not just happen in another part of the world or country, or only in the news, but it happens right here, at home. This phase represents an understanding of what types of measures and preparation will be helpful for future experiences.
The Evolution of the Healing Trajectory Visual Aid
The four visual aids below trace the evolution of emotional trajectories in response to disasters. Originally, the first three traced responses to natural storms. The fourth focuses on responses to human-caused disasters. Throughout the evolution you will note changes in senses of impact of events, perceived heights of newfound senses of normal, and labels used.
The first chart is used by national agencies, like the Center for Disease Control and Prevention, to depict phases of disaster response. As they note on their website, the following image describes phases that were first observed or described among natural disaster recovery practices. They are general principles and illustrate a scope of response to situations where no precise, universal timeline exists because responses vary by each disaster. This chart was first published in Disaster Mental Health Services (Myers and Wee, 2005).
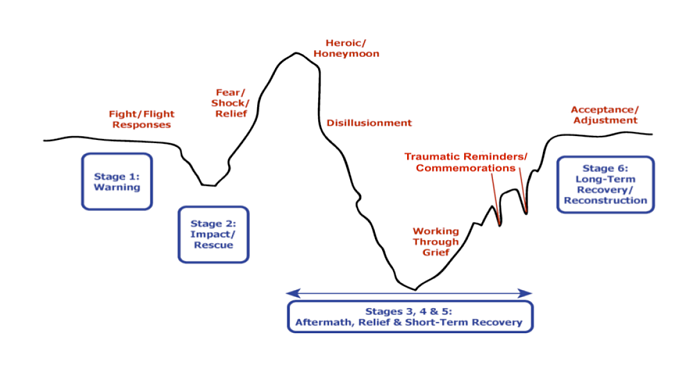
The second chart has been used by many agencies, again from observations of response to natural storms, to describe emotional impacts of disaster for the purposes of planning long-term reconstruction.
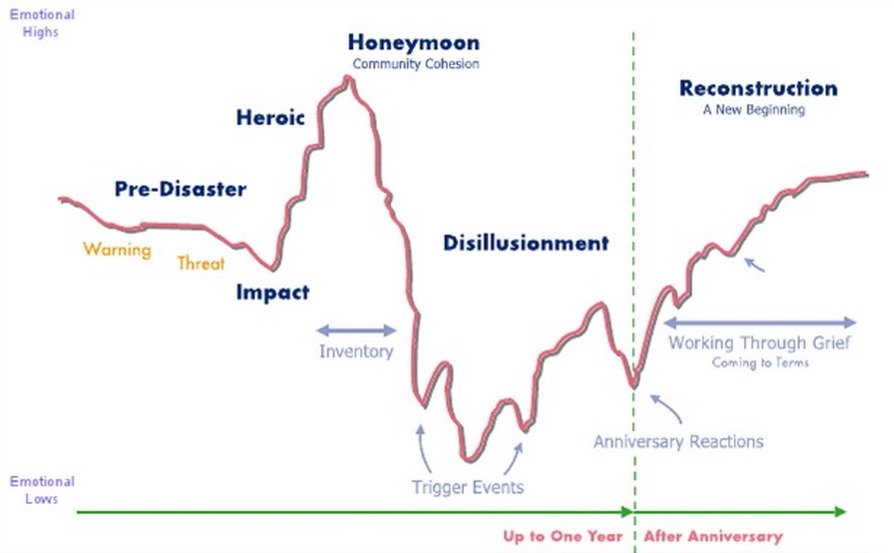
The third chart appears on many government agency sites and depicts general emotional responses and phases of restoration after disaster.
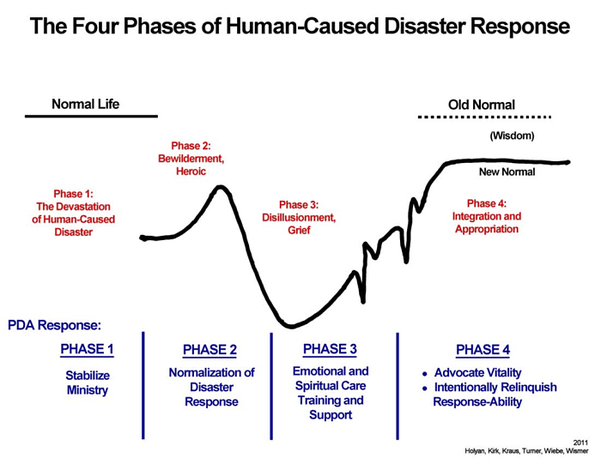
The fourth chart is a visual aid created by authors D. Holyan, J. Kirk, L. Kraus, R. Turner, K. Wiebe, and B. Wismer (2011), adapted from one of the original graphs intended to trace response to natural storms. It depicts a general emotional trajectory for a congregation following a human-caused disaster, which is distinctive from the emotional response to natural destruction, as well as four phases of response that Presbyterian Disaster Assistance (PDA/PCUSA) National Response teams use for emotional and spiritual care for clergy and congregations in crisis.
Many clergy and lay leaders that PDA has served have found this aid useful for identifying relational patterns and group dynamics in the months and years following an internal or community tragedy. It is important to recognize that the healing of each congregation is a unique experience, and that this visual aid is simply a tool to see general patterns. It is not prescriptive, but simply a guide. In the authors' experience, congregations generally take eighteen months to two years to travel the course of the trajectory.
Many clergy and lay leaders that PDA has served have found this aid useful for identifying relational patterns and group dynamics in the months and years following an internal or community tragedy. It is important to recognize that the healing of each congregation is a unique experience, and that this visual aid is simply a tool to see general patterns. It is not prescriptive, but simply a guide. In the authors' experience, congregations generally take eighteen months to two years to travel the course of the trajectory.